Here's How
1. Within a Workspace, select "Text Block" under Add Widget located in the top right corner of the Workspace screen under "Build New Chart".

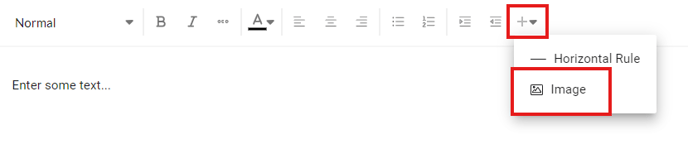
2. Within the text box widget, select the options icon located on the far right side of the top menu bar within the widget. Select "Image" to add an image to your text box.
3. Format your image, along with text, to provide additional context to your analysis within a Workspace, for example as part of your destructive physical analysis testing or as you analyze discharge capacity per cycle.

TIP: To wrap text or algin with your image, hover over your image and use the menu options presented at the center of the screen. To delete an image, use the trash icon to the right of that same menu.
