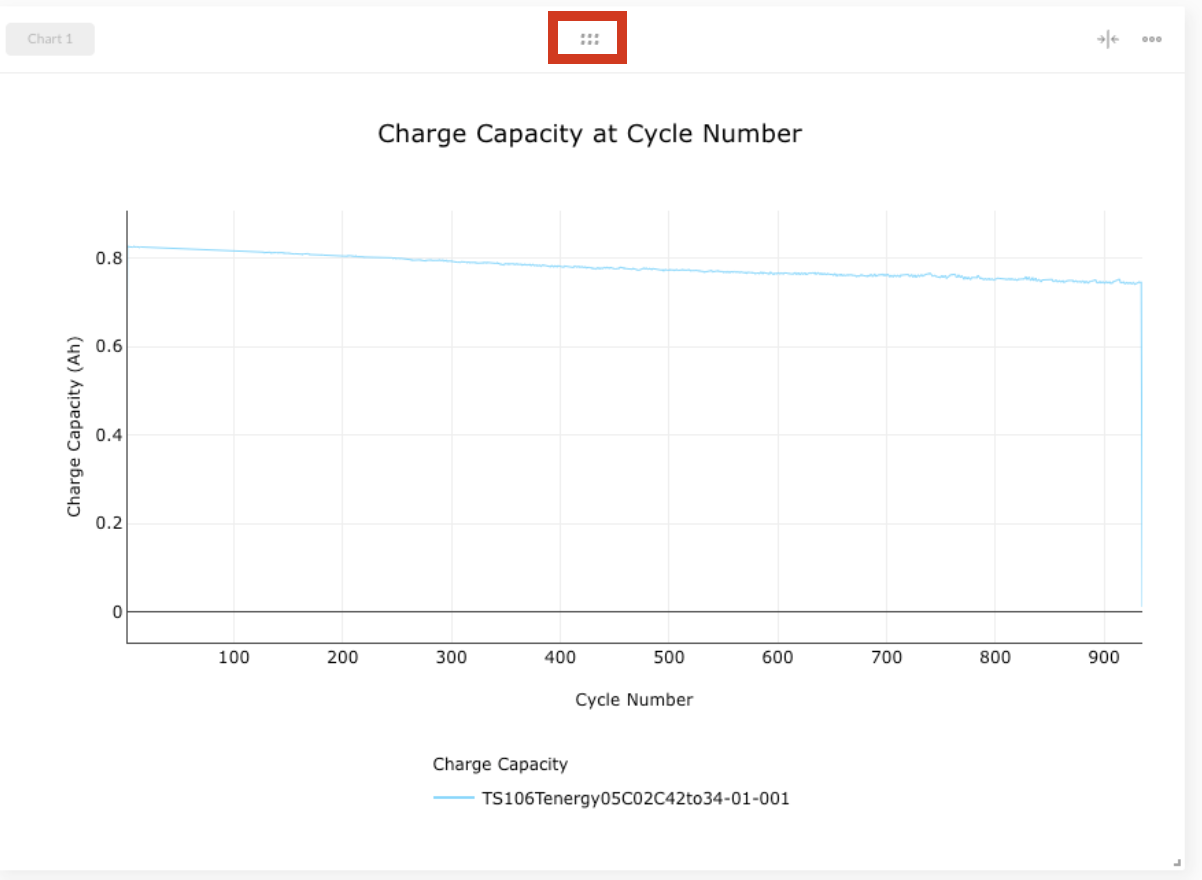
To move your plot, click and drag the six dot button in the top middle of a plot. Drag the plot in any direction to move it.
To resize your plot, click the resize icon in the top right of the chart. This will resize your plot to half of its original width.
Alternatively, click and drag the bottom right corner of the plot. You can create a custom plot size with this option.

By resizing and moving plots, you can move two charts to be side-by-side. This is a great way to visualize comparisons.
